Knowing a coordinate's elevation is useful. Knowing what the terrain does along an entire route is far more powerful. With the launch of the Elevation Profile API, OnCoord now lets developers submit an ordered list of coordinates and get back a full terrain analysis: cumulative climb and descent, grade statistics, steepest sections, and difficulty scoring — all in a single API call.
From Points to Routes
The existing /v1/elevation endpoint
returns the elevation at a single coordinate. The new
POST /v1/elevation/profile endpoint
accepts up to 500 coordinates in route order and returns a complete picture of the
terrain along that path. This makes it practical to answer questions like: how much
climbing does this delivery route involve? Where is the steepest section? How much
more energy will a vehicle consume compared to a flat road?
What the API Returns
Each profile response includes:
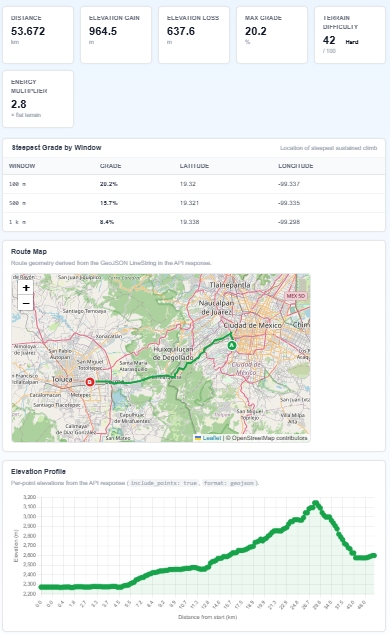
- Elevation gain and loss — cumulative metres climbed and descended along the route
- Grade analysis — maximum and average grade as a percentage, computed between consecutive points
- Steepest grades — the location and grade of the worst section, evaluated over 100 m, 500 m, and 1 km sliding windows. The three windows help distinguish a sharp spike from a sustained climb
- Terrain difficulty — a 0–100 score normalised against known LATAM corridors, from flat coastal highway to Andean switchbacks
- Energy multiplier — estimated energy cost relative to flat road, modelled for a reference freight vehicle
- Per-point detail — when
include_points: trueis set, each input coordinate is returned with its elevation, cumulative distance from the start, and grade to the next point
Built for Logistics and Fleet Applications
The primary use cases are logistics and fleet management. A delivery route that looks straightforward on a flat map can involve significant climbing through the Andes, the Serra do Mar, or the highlands west of Mexico City. The energy multiplier gives fleet operators a direct input for fuel estimation and EV range planning. The terrain difficulty score helps route planners prioritise roads that are genuinely easier on vehicles and drivers — not just shorter in distance.
GeoJSON Output for Map Integration
Setting format: geojson returns
a GeoJSON FeatureCollection ready for direct use in Leaflet, Mapbox, QGIS, or any
GIS tool. Summary statistics are in FeatureCollection.properties,
each route point becomes a GeoJSON Point Feature with its elevation as the Z coordinate,
and a LineString traces the full route — making it straightforward to render an
interactive elevation profile alongside a route map.
Data source: Elevation data is sourced from the Copernicus GLO-30 Digital Elevation Model at 30-metre resolution, covering all of OnCoord's Latin American footprint.
The Elevation Profile API pairs naturally with OnCoord's existing location intelligence endpoints. Combine it with population density and POI data to build a complete picture of a corridor — not just how hard it is to drive, but what commercial and demographic context surrounds it.
See the Elevation Profile documentation for the full API reference and interactive demo routes, or visit our Countries page for coverage details.